Equipment Utilization Rate: The Ultimate Guide to Fleet Efficiency
Learn how to calculate, track, and improve your equipment utilization rate. Maximize ROI and eliminate idle costs with data-driven fleet management.
Key Takeaways:
- Equipment utilization rate measures the percentage of available time your machines are actively working
- Industry benchmark: 60-70% utilization is considered healthy; below 50% signals problems
- Low utilization inflates your true cost-per-hour by 40-60%
- Tracking utilization reveals which machines to sell, rent out, or replace
- FieldFix automatically calculates utilization from logged hours vs. available time
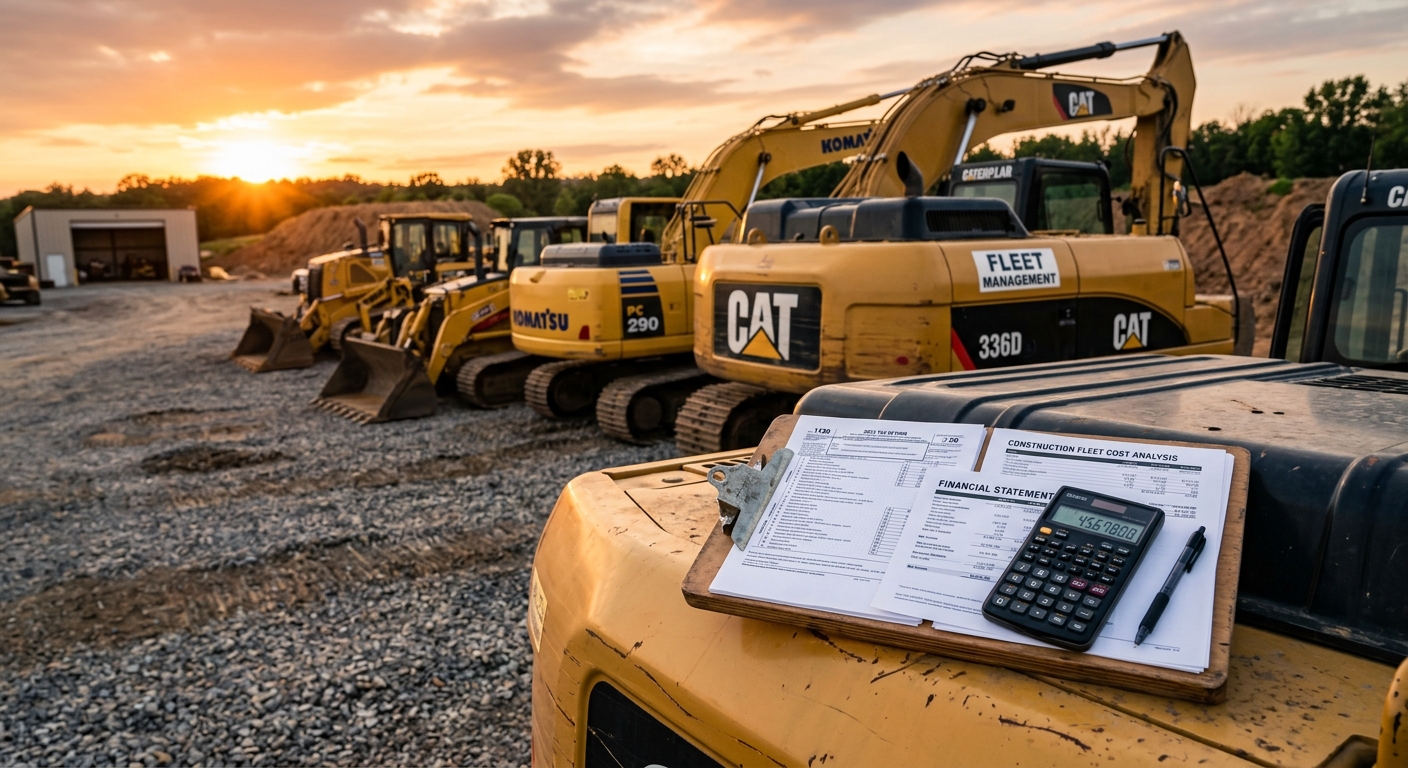
You just bought a $350,000 excavator. It sits in your yard for three weeks waiting for the right job. When it finally works, you run it hard for two months. Then it waits again.
At the end of the year, you realize that machine only logged 1,100 hours. On paper, your cost-per-hour calculations looked great—until you divide your total ownership costs by actual working hours instead of theoretical capacity.
That’s the utilization problem. And it’s silently destroying margins across the heavy equipment industry.
What Is Equipment Utilization Rate?
Equipment utilization rate is the percentage of available time that a machine is actually working. It’s the most honest metric for measuring whether your equipment is earning its keep.
The basic formula:
Utilization Rate Formula:
Utilization Rate = (Actual Operating Hours ÷ Available Hours) × 100
Where:
- Actual Operating Hours = Hours the machine ran (from hour meter)
- Available Hours = Total hours the machine could have been working
Sounds simple. The tricky part is defining “available hours.”
Defining Available Hours
There’s no universal standard, which is why you need to pick a definition and stick with it:
Method 1: Calendar-Based (Strictest)
- Available hours = 365 days × working hours per day
- For a 10-hour workday: 3,650 hours/year
- This method reveals true asset productivity
Method 2: Working-Days-Based (Common)
- Available hours = Working days × hours per day
- Example: 250 days × 10 hours = 2,500 hours/year
- Excludes weekends and holidays
Method 3: Scheduled-Based (Most Forgiving)
- Available hours = Only when machine was assigned to a job
- This hides scheduling and sales inefficiencies
- Useful for comparing operator performance, not fleet health
For fleet management decisions, use Method 2. It balances practicality with honesty.
Why Utilization Rate Matters More Than You Think
Most contractors focus on cost-per-hour calculations. They figure out their hourly ownership cost (depreciation, insurance, financing) and operating cost (fuel, maintenance, repairs). Then they bid jobs accordingly.
Here’s the problem: those calculations assume a certain number of annual hours. If you don’t hit those hours, your actual cost-per-hour is much higher than you calculated.
Let’s make this concrete:
Your $350,000 Excavator:
- Annual ownership cost (depreciation, insurance, financing): $52,000
- Assumed hours: 1,500/year
- Calculated hourly ownership cost: $34.67/hour
But you only logged 1,100 hours:
- Actual hourly ownership cost: $47.27/hour
- You underbid every job by $12.60/hour
At 1,100 hours, that’s $13,860 in lost margin you didn’t even know about.
The Utilization Trap: Low utilization doesn’t just mean idle equipment—it means every hour you DID work cost more than you calculated. You’re bleeding money on the jobs you win, not just the downtime between them.
How to Calculate Equipment Utilization Rate
Let’s walk through a real calculation using the working-days method.
Step 1: Determine Available Hours
For a typical contractor operation:
- Working days: 5 days/week × 50 weeks = 250 days
- Hours per day: 10 hours
- Available hours: 2,500/year
Adjust for your actual operation. If you run 6 days a week or 12-hour days, recalculate accordingly.
Step 2: Log Actual Operating Hours
Pull the hour meter readings from:
- Start of period
- End of period
- Calculate: End - Start = Operating hours
For accuracy, log hours weekly. Relying on quarterly readings misses seasonal patterns.
Step 3: Calculate the Rate
Example: 2025 Compact Track Loader
- January 1 reading: 2,340 hours
- December 31 reading: 3,680 hours
- Operating hours: 1,340 hours
- Available hours: 2,500 hours
Utilization Rate = (1,340 ÷ 2,500) × 100 = 53.6%
That’s below the 60% benchmark. Time to investigate why.
Industry Benchmarks by Equipment Type
Utilization expectations vary by machine type and business model:
Detailed Benchmarks
| Equipment Type | Excellent | Healthy | Concerning | Critical |
|---|---|---|---|---|
| Excavators | >70% | 60-70% | 50-60% | <50% |
| Skid Steers/CTLs | >75% | 65-75% | 55-65% | <55% |
| Dozers | >65% | 55-65% | 45-55% | <45% |
| Wheel Loaders | >70% | 60-70% | 50-60% | <50% |
| Telehandlers | >60% | 50-60% | 40-50% | <40% |
| Forestry Mulchers | >55% | 45-55% | 35-45% | <35% |
Why specialty equipment has lower benchmarks: Forestry mulchers, trenchers, and similar machines often serve niche markets with seasonal demand. A 50% utilization rate might be excellent for a forestry mulcher that only makes sense on specific land-clearing jobs.
Pro Tip: Compare your machines to YOUR fleet average, not just industry benchmarks. If your excavator fleet averages 65% and one unit sits at 45%, investigate that specific machine regardless of industry norms.
The Hidden Cost of Low Utilization
Low utilization creates costs beyond the obvious “idle machine” problem:
1. Inflated True Cost-Per-Hour
As shown earlier, your ownership costs spread across fewer hours. Every working hour carries a heavier burden.
2. Maintenance Timing Misalignment
Oil changes, filter replacements, and inspections are scheduled by hours. Low-utilization machines reach these intervals slowly—meaning time-based degradation (rust, seal dry-out, battery discharge) occurs between services.
A machine that logs 800 hours over two years has different wear patterns than one logging 800 hours in six months.
3. Capital Trapped in Unproductive Assets
That $350,000 sitting in your yard could be:
- Earning interest elsewhere
- Invested in marketing for more jobs
- Used for equipment that WOULD be utilized
Opportunity cost is real, even if it doesn’t show on financial statements.
4. Insurance and Registration Waste
You’re paying insurance on machines that sit. Full coverage on an asset generating zero revenue.
Case Study: The Hidden $28,000
A landscaping contractor had three skid steers. Annual costs per unit:
- Insurance: $2,400
- Registration/taxes: $800
- Financing: $12,000
- Storage space allocation: $1,200
Total fixed cost: $16,400/unit/year
One skid steer ran only 400 hours (26% utilization). Fixed cost per hour: $41/hour just in ownership—before fuel, maintenance, or operator wages.
The other two ran 1,200 hours each (78% utilization). Fixed cost per hour: $13.67/hour.
By selling the underperforming unit and renting when needed, they saved $28,000 annually.
5 Strategies to Improve Utilization
Strategy 1: Right-Size Your Fleet
The most effective utilization improvement is owning fewer machines.
The math:
- 3 machines at 50% utilization = 1.5 machine-equivalents of work
- 2 machines at 75% utilization = 1.5 machine-equivalents of work
- Same output, lower cost
Sell underperforming units. Rent for peak demand instead of owning for capacity you rarely need.
Strategy 2: Diversify Your Service Mix
If your excavator sits idle during certain seasons, find work that fills those gaps:
- Excavation contractor? Add snow removal in winter
- Land clearing? Add demolition services
- Site prep? Add drainage work
Each service addition smooths your utilization curve.
Strategy 3: Offer Rental or Subcontracting
When your equipment sits, rent it to other contractors. Many equipment owners resist this—they worry about wear and damage. But:
- A sitting machine still depreciates
- A rented machine earns revenue AND depreciates
- Proper rental agreements include damage coverage
Even below-market rental rates beat zero revenue.
Strategy 4: Improve Job Scheduling
Utilization drops between jobs. The gap from finishing one project to mobilizing for the next costs hours.
Reduce gaps by:
- Lining up next jobs before current ones finish
- Reducing estimate-to-booking time
- Pre-staging equipment for known upcoming work
- Building relationships for repeat business (shorter sales cycles)
Strategy 5: Extend Operating Hours
If you’re maxed on working days, extend the hours per day:
- Second-shift crews on high-demand equipment
- Weekend work during peak season
- Lighting for early morning/evening operation
More hours from the same assets = higher utilization and lower cost-per-hour.
How to Track Utilization Effectively
Manual tracking (spreadsheets, paper logs) fails for two reasons:
- Hour meter readings require someone physically checking machines
- Manual data entry creates lag time and errors
Automated Tracking Options
Telematics Systems: Most major manufacturers offer OEM telematics (John Deere JDLink, CAT Product Link, Komatsu KOMTRAX). These automatically report hours.
Aftermarket GPS Trackers: If OEM telematics isn’t available or costs too much, aftermarket trackers can monitor engine-on time.
Fleet Management Software: Solutions like FieldFix integrate hour data with cost tracking, automatically calculating utilization rates and true cost-per-hour.
FieldFix Utilization Tracking: Log your hours weekly (or connect telematics), and FieldFix automatically calculates utilization rate alongside your cost-per-hour metrics. You’ll see exactly how utilization affects your true costs—not your assumed costs.
What to Track
At minimum, track these metrics monthly:
- Operating hours by machine
- Utilization rate by machine
- Fleet average utilization
- True cost-per-hour (accounting for actual hours)
- Revenue generated per machine (if possible)
The best operators track weekly and review monthly patterns.
When Low Utilization Is Actually Good
Not all low utilization is bad. Some machines SHOULD have lower rates:
Backup Equipment
If your business depends on uptime, a backup machine provides insurance. A 30% utilized backup that prevents a 40-hour production stoppage might be worth it.
Calculate: (Hourly revenue × downtime hours avoided) vs. (Annual cost of backup)
Specialty Attachments and Machines
A trencher that runs 300 hours/year might still be profitable if:
- Trenching jobs have high margins
- Rental alternatives are expensive or unavailable
- It enables you to win contracts you’d otherwise lose
Growing Into Capacity
Just bought a new excavator expecting business growth? Low first-year utilization might be acceptable if utilization trends upward.
Track the trend. Flat or declining utilization over 18+ months signals a problem.
The Decision Framework: Low utilization is acceptable when the machine serves a strategic purpose beyond direct revenue. But that purpose should be defined, documented, and reviewed annually. “We might need it” isn’t a strategy.
Real-World Utilization Analysis
Let’s analyze a sample fleet to demonstrate practical application:
Fleet Analysis: 5-Machine Operation
| Machine | Annual Hours | Utilization | Action |
|---|---|---|---|
| Excavator 1 | 1,480 | 59% | Monitor - slightly below target |
| Excavator 2 | 1,720 | 69% | Healthy - maintain |
| Skid Steer 1 | 1,890 | 76% | Excellent - consider adding unit |
| Skid Steer 2 | 1,050 | 42% | Problem - investigate |
| Mini Ex | 820 | 33% | Critical - sell or repurpose |
Analysis:
- Skid Steer 2 at 42%: Why so low? Check for mechanical issues, operator preference, or job scheduling problems. If no fix possible, sell it.
- Mini Ex at 33%: Unless this serves a specific niche with high margins, it’s bleeding money. Consider selling and renting when needed.
- Skid Steer 1 at 76%: This is your workhorse. If jobs exist but this machine is always booked, consider adding capacity.
Recommendation: Sell the mini excavator, fix or sell Skid Steer 2, potentially add another skid steer. Net result: Same work capacity, higher utilization, lower total cost.
Building a Utilization Culture
The best fleet operators don’t just track utilization—they make it part of every decision:
- Before purchasing: “At what utilization will this machine pay for itself?”
- When bidding jobs: “Which machines need hours right now?”
- When scheduling: “How do we minimize equipment idle time between jobs?”
- When reviewing financials: “What’s our fleet-wide utilization trend?”
Utilization awareness transforms how you run equipment. Instead of reacting to costs, you proactively manage asset productivity.
Start Tracking Your True Utilization
Most fleet owners overestimate their utilization by 15-20%. The first step is honest measurement.
FieldFix makes utilization tracking automatic—log your hours, and we calculate utilization alongside your true cost-per-hour. See which machines earn their keep and which ones are silently draining your margins.
Up to 3 machines free, forever. No credit card required.