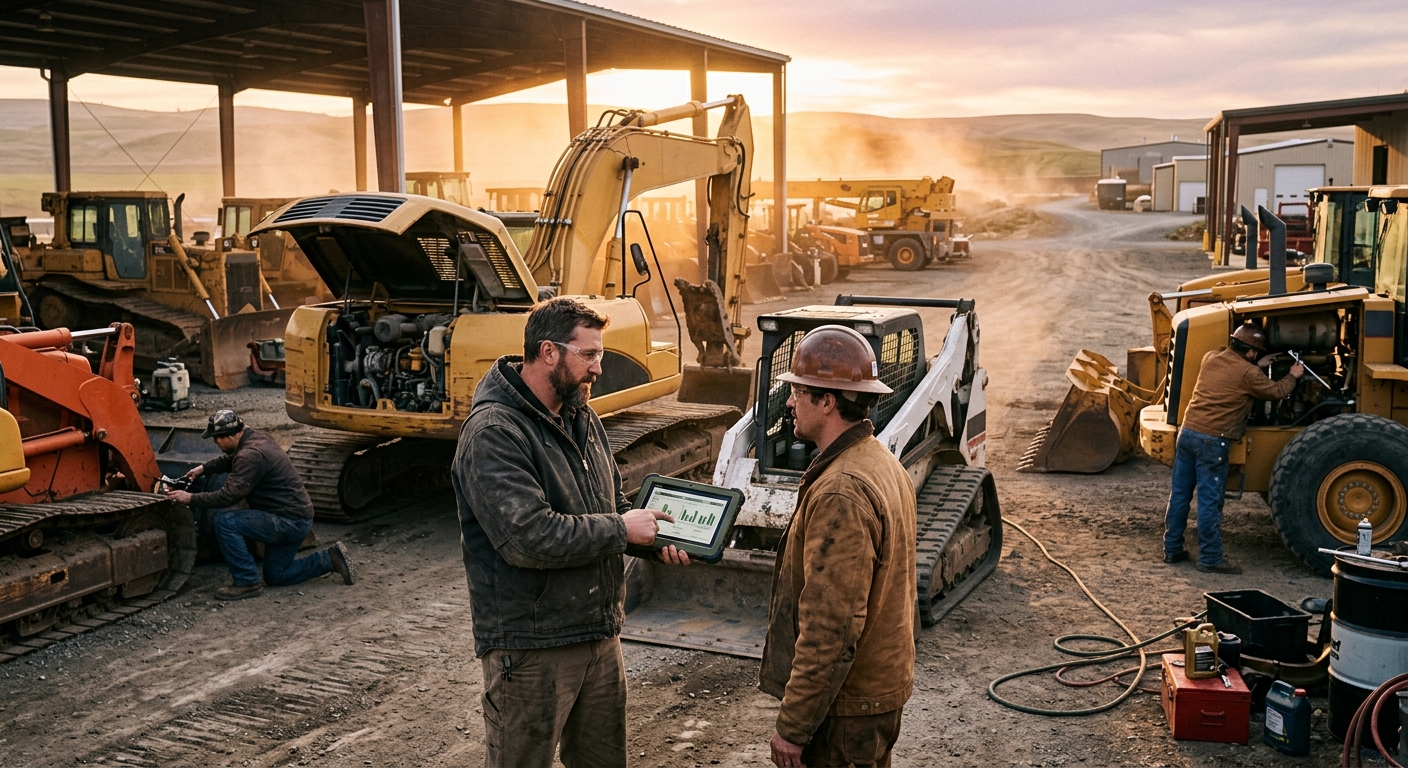
Heavy Equipment Maintenance KPIs: 12 Metrics Every Fleet Should Track
Track the right heavy equipment maintenance KPIs to cut downtime, control repair costs, and build a smarter fleet maintenance dashboard in 2026.
Key Takeaways:
- The best maintenance dashboards focus on 12 core KPIs, not 50 vanity metrics
- Downtime, PM compliance, wrench time, and repeat failures reveal most fleet problems fast
- Good KPI tracking helps fleets catch issues before they turn into expensive emergency repairs
- Metrics only matter if you review them consistently and assign clear owners for follow-up
- A simple digital system beats whiteboards and memory every single time
Most equipment fleets do not have a maintenance problem because they lack hardworking mechanics. They have a visibility problem. Machines break, parts get ordered, techs scramble, jobs slow down, and everyone promises to “stay on top of it next time.” Then next time shows up with a blown hose, a dead battery, a missed service, or an avoidable failure that eats half a day and half the shop’s patience.
That cycle usually happens because the fleet is being managed by memory, texts, paper notes, and gut feel. Those methods feel fast in the moment, but they hide patterns. You do not see whether one crew is abusing machines, whether scheduled service is slipping, whether labor hours are being spent productively, or whether one asset has quietly become a money pit.
That is where maintenance KPIs come in.
The right key performance indicators turn maintenance from reactive chaos into a system you can improve. They give owners, service managers, and field supervisors a shared scoreboard. They also make it much easier to justify staffing, service intervals, replacement decisions, and software investments because you are no longer arguing from vague frustration. You are arguing from numbers.
Why Maintenance KPIs Matter
Fleet owners often track obvious numbers like total repair spend and maybe engine hours. That is a start, but it is not enough. A useful dashboard connects reliability, cost, labor, and planning into one picture.
When you track maintenance KPIs consistently, you can:
- Spot problem assets before they destroy margins
- Reduce surprise downtime during active jobs
- Hold operators and technicians accountable with facts instead of blame
- Improve parts planning and service scheduling
- Decide whether to repair, rebuild, rent, or replace with more confidence
If you are a contractor running a small fleet, this is even more important. One down machine can throw off a whole schedule. You do not have the luxury of hiding inefficiency inside a massive operation. Every missed service and repeat breakdown hits harder.
The 12 KPIs That Actually Matter
Here are the KPIs worth putting on your dashboard first.
1. Downtime Hours per Machine
Track how many hours each machine is unavailable due to maintenance or repair. This is one of the clearest indicators of reliability pain.
Why it matters: downtime is where maintenance problems become business problems. A machine can have modest repair spend and still wreck production if it is unavailable at the wrong time.
2. Preventive Maintenance Compliance Rate
This is the percentage of scheduled PM services completed on time.
Formula: completed PMs on time / total scheduled PMs
If this number is weak, your shop is likely living in reactive mode. Missed PMs are often the first sign that the maintenance system is losing control.
3. Mean Time Between Failures (MTBF)
MTBF measures the average operating time between unplanned failures for a machine or asset class.
You do not need aerospace-level math here. Even a rough MTBF estimate can show whether reliability is improving or sliding backward. If a wheel loader is failing every 90 hours instead of every 300, something is wrong long before year-end costs tell the story.
4. Mean Time to Repair (MTTR)
MTTR tracks how long it takes to diagnose, repair, test, and return a machine to service.
This reveals process friction. High MTTR can point to poor parts availability, bad troubleshooting workflows, missing service information, or too much technician time lost walking, waiting, and chasing approvals.
5. Planned vs Unplanned Maintenance Ratio
How much of your work is scheduled versus emergency?
Healthy fleets push more labor into planned work because it is cheaper, safer, and easier to schedule. Too much unplanned work means the shop is constantly getting punched in the face by surprises.
6. Maintenance Cost per Operating Hour
This metric turns repair spend into something you can compare across machines with different usage levels.
Formula: total maintenance cost / operating hours
This is especially useful when comparing sister machines or deciding whether an older asset is still worth keeping.
7. Repeat Failure Rate
Repeat failures happen when the same issue, component, or symptom comes back shortly after repair.
That usually means one of three things:
- The root cause was never fixed
- The repair quality was weak
- The machine is being operated in a way that keeps recreating the problem
Repeat failures are brutal because you pay twice and trust drops fast.
8. Wrench Time Percentage
Wrench time is the portion of technician hours spent actually turning tools instead of hunting parts, driving, waiting, or doing admin.
This KPI is underrated. If your techs are good but wrench time is low, the system is wasting them.
9. Parts Fill Rate
This measures how often needed parts are available when work begins.
Low fill rates stretch repairs, inflate downtime, and force ugly workarounds. You do not need to stock everything, but you should know which consumables and high-failure items repeatedly slow the team down.
10. Open Work Orders by Age
It is not enough to count open work orders. You need to know how old they are.
Ten fresh work orders can be fine. Three work orders that have been sitting for 21 days usually mean something is stuck: approvals, parts, labor capacity, or ownership.
11. Inspection Defect Closure Rate
When operators or techs note defects during inspections, how quickly are those issues resolved?
This KPI helps you separate a fleet that only collects problems from a fleet that actually closes them.
12. Asset Reliability Ranking
Every fleet should rank machines from best to worst based on downtime, repair spend, repeat failures, and PM compliance.
This helps you stop treating all equipment equally. A few problem assets are often responsible for a wildly unfair share of shop attention.
Simple Dashboard Approach
- ✅ Easier to maintain
- ✅ Faster to review in weekly meetings
- ✅ Better adoption by small teams
- ❌ May miss edge-case detail
Overbuilt Dashboard Approach
- ✅ Looks impressive in a spreadsheet
- ✅ Can support larger organizations
- ❌ Usually ignored after the first month
- ❌ Hides important signals under too much noise
How to Build a Useful Dashboard
The best dashboard is not the prettiest one. It is the one your team actually updates and reviews.
Start by organizing your data around four buckets:
- Asset data: machine ID, make, model, hours, location
- Work order data: issue type, priority, labor hours, parts cost, cause, downtime
- Inspection data: defects found, severity, due dates, closure dates
- Scheduling data: PM intervals, last service date, next due date
Then keep the dashboard brutally practical. A good first version should show:
- Top 5 machines by downtime this month
- PM compliance this month and quarter
- Open work orders by priority and age
- Unplanned repair count by machine class
- Maintenance cost per hour for major assets
- Repeat failures needing root-cause review
Avoid building a dashboard that depends on heroic manual effort. If technicians hate entering the data, the dashboard dies. If supervisors cannot review it in 10 minutes, it turns into decoration.
What Good vs Bad Numbers Look Like
There is no universal benchmark that fits every fleet, but you can still set strong internal targets.
For example:
- PM compliance should trend high and stay stable
- MTTR should shrink as workflows improve
- Repeat failures should be rare and investigated immediately
- Open high-priority work orders should not age quietly
- Unplanned work should not dominate technician time month after month
The real goal is trend visibility. A dashboard earns its keep when it answers, “Are we getting better or worse?”
Common KPI Mistakes
The numbers can lie if the process behind them is sloppy.
Common mistakes include:
- Counting scheduled but incomplete PMs as “handled”
- Logging vague failure causes like “hydraulic issue” with no usable detail
- Ignoring small repeat issues because the machine stayed operational
- Mixing operator damage, normal wear, and shop error into one bucket
- Reviewing KPIs monthly when weekly action is needed
Another mistake is tracking everything at the fleet level only. Fleet averages can hide disasters. One chronically failing machine can disappear inside a blended metric if you are not also looking asset by asset.
A Real-World Example
Once the team started tracking downtime hours, repeat failures, and open work order age, the problem became obvious. The skid steer had three recurring electrical faults tied to connector corrosion, and the excavator had multiple incomplete repairs waiting on parts because nobody owned follow-up. Within two months, the fleet tightened PM scheduling, stocked common connectors, closed aging work orders faster, and cut disruption without adding headcount.
That is the real power of KPI tracking. It does not magically repair machines. It shows you where the bullshit is hiding.
How FieldFix Helps
Most fleets do not need more spreadsheets. They need one system that connects inspections, service history, work orders, photos, costs, and machine hours in a way that is easy to use in the field.
FieldFix helps teams:
- Log work orders and defects from the jobsite
- Track service history by machine
- Surface repeat issues and maintenance trends
- Review asset-level performance without guessing
- Build cleaner records for repair, replacement, and budgeting decisions
If you want a maintenance dashboard that actually improves decisions, start simple. Pick the 12 KPIs above, review them every week, and tie each bad trend to an action owner. That is how fleets stop reacting and start managing.
FieldFix helps contractors track maintenance history, downtime patterns, inspections, and repair activity in one place so small issues stop turning into expensive surprises.
See how FieldFix helps modern fleets stay ahead of maintenance.
Related Articles
September 4, 2026
Heavy Equipment Fall Service Planning Guide: How to Prevent Winter Downtime
September 3, 2026
Horizontal Directional Drill Maintenance: The Complete HDD Service Guide for Contractors
September 2, 2026